1. Data Warehouse Overview
Module 1: Data Warehouse Overview#
Overview#
This module explains the general structure of an EDU data warehouse. This is a great starting point if you're a new user of EDU, or if you need a reminder how things fit together. You'll learn how the EDU warehouse is structured, which databases and schemas exist, and how to interpret the tables inside them.
The goal is not to memorize every schema or table, but to build a mental model of where different kinds of data live and why they are organized the way they are.
Learing Objectives#
This module follows a clear learning flow, moving from the broadest level of organization down to the specific:
- Databases - The top-level containers that separate different types of data (raw vs. analytics-ready)
- Schemas - The organizational layers within databases that represent different stages of data transformation
- Tables - The actual data structures you'll query, organized into two main types: dimensions and facts
By the end of this module, you will understand:
- How EDU organizes data hierarchically: databases → schemas → tables
- The difference between RAW and ANALYTICS databases and when to use each
- Common schemas in the ANALYTICS database and their purposes
- The two main types of tables (dimensions and facts) and how they work together
- Where to find the data you need for most analysis work
Principles of the Data Warehouse#
The core purpose of the EDU Warehouse is to give you ready-to-use reporting tables that behave consistently across your data. The warehouse organizes data in a predictable, hierarchical structure that makes it easy to find what you need and understand how different pieces of data relate to each other.
Rather than working with raw, unprocessed data from source systems, EDU provides you with:
- Cleaned and standardized data - Data have consistent formats, naming conventions, and data types
- Organized structure - Tables are intentionally structured, following dimensional modeling principles
- Reliable relationships - Tables are designed to join together predictably
- Documentation - Tables and columns are documented so you understand what each piece of data represents
This structure saves you time and reduces errors by handling the complex work of data transformation and organization upfront, so you can focus on analysis rather than data preparation.
Databases#
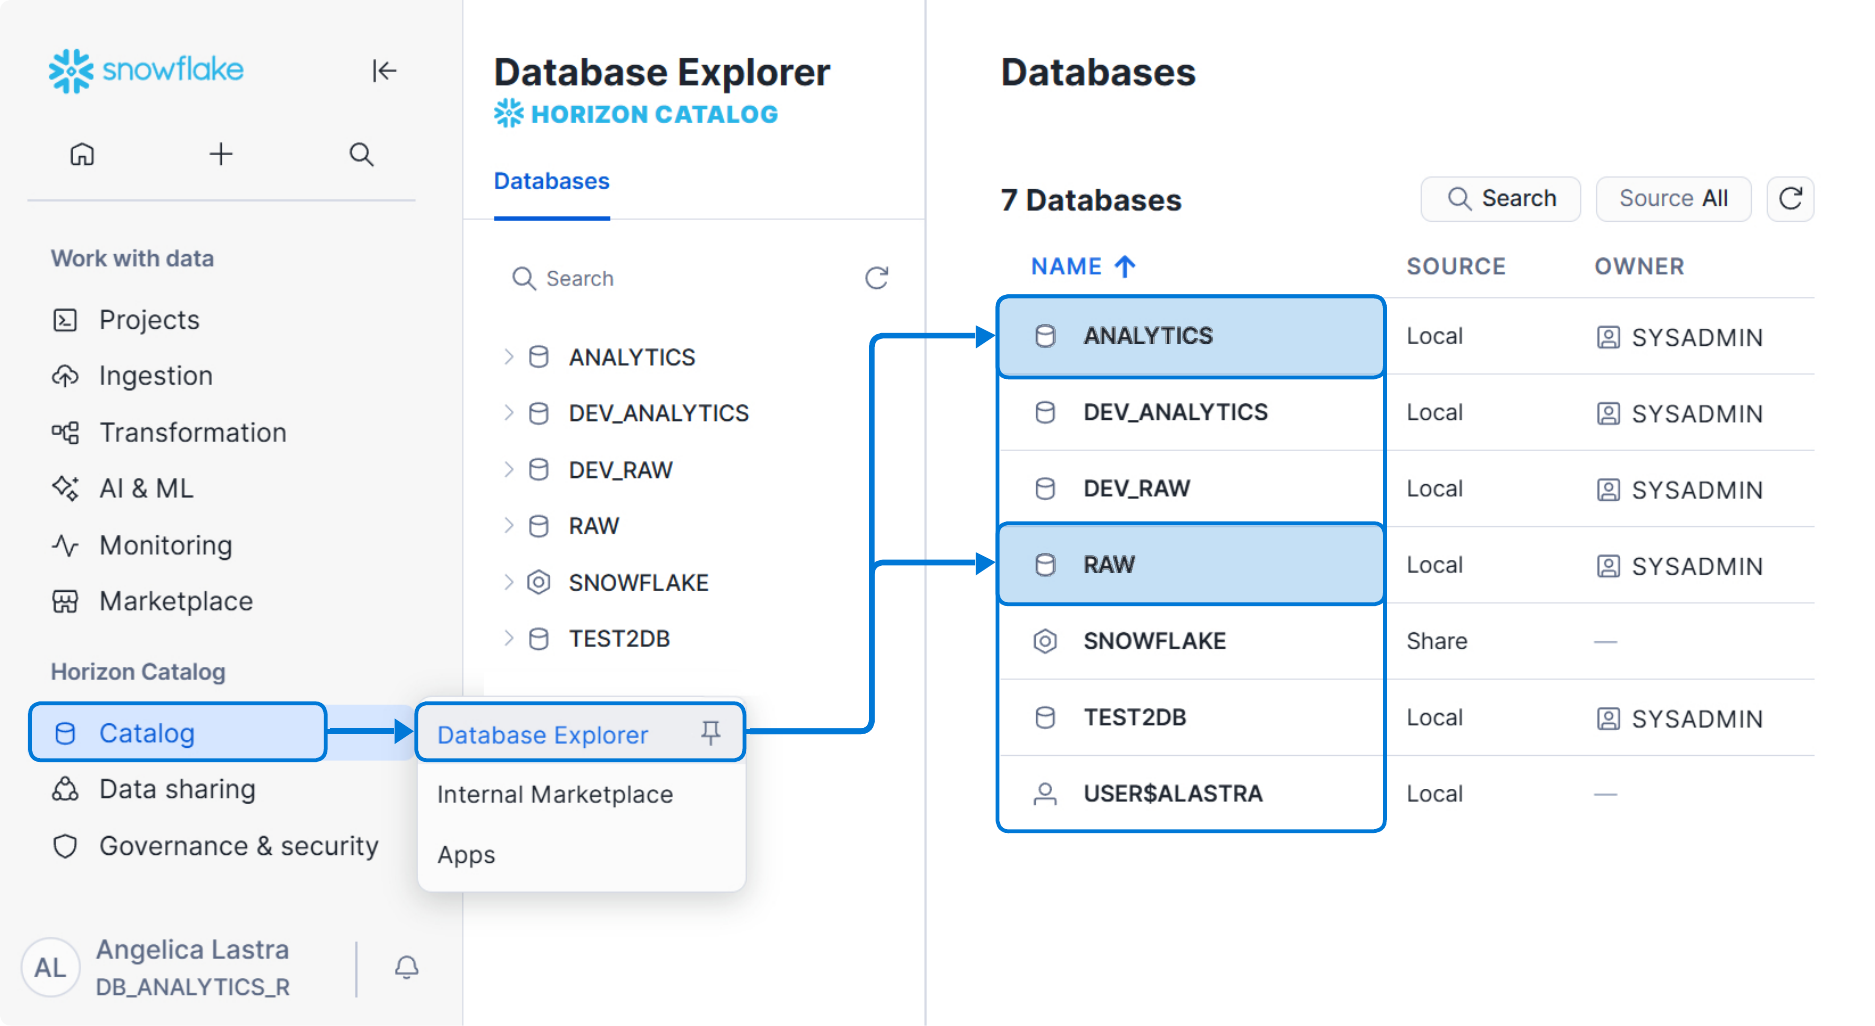
EDU organizes data into databases, which contain schemas, which in turn contain tables and views. In some cases, it is helpful to think of this structure as folders within folders which eventually contain the tables you will query:

In most EDU user workflows, you'll primarily query one database: ANALYTICS, which contains analytics-ready tables designed for reporting and analysis. Depending on your role and environment you may also see other databases, such as RAW (source-aligned data, often restricted and mostly used for debugging/traceability), development or release-candidate environments (sometimes named DEV_ANALYTICS or prefixed with RC_), and Snowflake system databases that are generally not relevant to everyday analysis.

The RAW database#
The RAW database contains data as it is extracted from source systems, with little to no transformation applied. It represents the earliest stage of the EDU pipeline and preserves source-aligned structures for traceability and debugging. It is usually formatted with some metadata information about the data ingestion process (filename, tenant_code, api_year, timestamp and more) and a v (variant) column which contains all the data ingested as an array.
Data in RAW is not designed for analytics or reporting. Access may be limited depending on your role, and most analysts will not need to query this database directly.
See an example: Assessment data in the Raw Database
| FILENAME | FILE_ROW_NUMBER | TENANT_CODE | API_YEAR | PULL_DATE | PULL_TIMESTAMP | NAME | ODS_VERSION | DATA_MODEL_VERSION | V |
|---|---|---|---|---|---|---|---|---|---|
| tenant_01/2024/Assessments.jsonl | 1 | tenant_01 | 2024 | 2025-08-15 | 2025-08-15 07:08:17.441 -0700 | assessments__staar | 7.1 | 4.0.0 | {"academicSubjects": [{"academicSubjectDescriptor": "uri://ed-fi.org/AcademicSubjectDescriptor#Mathematics"}], "assessedGradeLevels": [{"gradeLevelDescriptor": "uri://ed-fi.org/GradeLevelDescriptor#Third grade"}, {"gradeLevelDescriptor": "uri://ed-fi.org/GradeLevelDescriptor#Fourth grade"}, ..., {"gradeLevelDescriptor": "uri://ed-fi.org/GradeLevelDescriptor#Twelfth grade"}], "assessmentCategoryDescriptor": "uri://ed-fi.org/AssessmentCategoryDescriptor#State assessment", "assessmentFamily": "STAAR", "assessmentIdentifier": "STAAR_Mathematics", "assessmentTitle": "STAAR Mathematics", "namespace": "uri://ed-fi.org/Assessment", "performanceLevels": [{"assessmentReportingMethodDescriptor": "uri://ed-fi.org/Assessment/AssessmentReportingMethodDescriptor#Overall Proficiency level", "performanceLevelDescriptor": "uri://ed-fi.org/Assessment/PerformanceLevelDescriptor#Did not Meet", "resultDatatypeTypeDescriptor": "uri://ed-fi.org/ResultDatatypeTypeDescriptor#Level"}, ..., {"assessmentReportingMethodDescriptor": "uri://ed-fi.org/Assessment/AssessmentReportingMethodDescriptor#Overall Proficiency level", "performanceLevelDescriptor": "uri://ed-fi.org/Assessment/PerformanceLevelDescriptor#Masters", "resultDatatypeTypeDescriptor": "uri://ed-fi.org/ResultDatatypeTypeDescriptor#Level"}], "scores": [{"assessmentReportingMethodDescriptor": "uri://ed-fi.org/Assessment/AssessmentReportingMethodDescriptor#Total Scale Score", "resultDatatypeTypeDescriptor": "uri://ed-fi.org/ResultDatatypeTypeDescriptor#Integer"}]} |
| tenant_01/2025/Assessments.jsonl | 2 | tenant_01 | 2025 | 2025-08-15 | 2025-08-15 07:08:17.441 -0700 | assessments__staar | 7.1 | 4.0.0 | {"academicSubjects": [{"academicSubjectDescriptor": "uri://ed-fi.org/AcademicSubjectDescriptor#Reading"}], "assessedGradeLevels": [{"gradeLevelDescriptor": "uri://ed-fi.org/GradeLevelDescriptor#Third grade"}, {"gradeLevelDescriptor": "uri://ed-fi.org/GradeLevelDescriptor#Fourth grade"}, ..., {"gradeLevelDescriptor": "uri://ed-fi.org/GradeLevelDescriptor#Twelfth grade"}], "assessmentCategoryDescriptor": "uri://ed-fi.org/AssessmentCategoryDescriptor#State assessment", "assessmentFamily": "STAAR", "assessmentIdentifier": "STAAR_Read", "assessmentTitle": "STAAR Read", "namespace": "uri://ed-fi.org/Assessment", "performanceLevels": [{"assessmentReportingMethodDescriptor": "uri://ed-fi.org/Assessment/AssessmentReportingMethodDescriptor#Overall Proficiency level", "performanceLevelDescriptor": "uri://ed-fi.org/Assessment/PerformanceLevelDescriptor#Did not Meet", "resultDatatypeTypeDescriptor": "uri://ed-fi.org/ResultDatatypeTypeDescriptor#Level"}, ..., {"assessmentReportingMethodDescriptor": "uri://ed-fi.org/Assessment/AssessmentReportingMethodDescriptor#Overall Proficiency level", "performanceLevelDescriptor": "uri://ed-fi.org/Assessment/PerformanceLevelDescriptor#Masters", "resultDatatypeTypeDescriptor": "uri://ed-fi.org/ResultDatatypeTypeDescriptor#Level"}], "scores": [{"assessmentReportingMethodDescriptor": "uri://ed-fi.org/Assessment/AssessmentReportingMethodDescriptor#Total Scale Score", "resultDatatypeTypeDescriptor": "uri://ed-fi.org/ResultDatatypeTypeDescriptor#Integer"}]} |
| tenant_01/2026/Assessments.jsonl | 2 | tenant_01 | 2026 | 2025-08-15 | 2025-08-15 07:08:17.441 -0700 | assessments__staar | 7.1 | 4.0.0 | {"academicSubjects": [{"academicSubjectDescriptor": "uri://ed-fi.org/AcademicSubjectDescriptor#Mathematics"}], "assessedGradeLevels": [{"gradeLevelDescriptor": "uri://ed-fi.org/GradeLevelDescriptor#Third grade"}, {"gradeLevelDescriptor": "uri://ed-fi.org/GradeLevelDescriptor#Fourth grade"}, ..., {"gradeLevelDescriptor": "uri://ed-fi.org/GradeLevelDescriptor#Twelfth grade"}], "assessmentCategoryDescriptor": "uri://ed-fi.org/AssessmentCategoryDescriptor#State assessment", "assessmentFamily": "STAAR", "assessmentIdentifier": "STAAR_Mathematics", "assessmentTitle": "STAAR Mathematics", "namespace": "uri://ed-fi.org/Assessment", "performanceLevels": [{"assessmentReportingMethodDescriptor": "uri://ed-fi.org/Assessment/AssessmentReportingMethodDescriptor#Overall Proficiency level", "performanceLevelDescriptor": "uri://ed-fi.org/Assessment/PerformanceLevelDescriptor#Did not Meet", "resultDatatypeTypeDescriptor": "uri://ed-fi.org/ResultDatatypeTypeDescriptor#Level"}, ..., {"assessmentReportingMethodDescriptor": "uri://ed-fi.org/Assessment/AssessmentReportingMethodDescriptor#Overall Proficiency level", "performanceLevelDescriptor": "uri://ed-fi.org/Assessment/PerformanceLevelDescriptor#Masters", "resultDatatypeTypeDescriptor": "uri://ed-fi.org/ResultDatatypeTypeDescriptor#Level"}], "scores": [{"assessmentReportingMethodDescriptor": "uri://ed-fi.org/Assessment/AssessmentReportingMethodDescriptor#Total Scale Score", "resultDatatypeTypeDescriptor": "uri://ed-fi.org/ResultDatatypeTypeDescriptor#Integer"}]} |
The ANALYTICS database#
The ANALYTICS database contains the data models designed for reporting and analysis. This is where EDU's transformation logic ultimately lands, and where analysts query data.
Within ANALYTICS, data is organized into multiple schemas. Each schema represents a different stage or purpose in the data pipeline. While you may see several schemas listed, only a few are essential to understand. You can reference the diagram below for a list of common schemas in the ANALYTICS database:

Schemas#
Schemas represent different stages or purposes in the pipeline. You don't need to memorize them, but it helps to recognize a few common ones so you know where you are when browsing the Catalog. As a User, you will likely always query from schemas prefixed with 'prod_' - this is short for 'production'. These schemas are typically updated daily by the production data pipeline, and house the most trustworthy data an EDU system has to offer.
prod_seed#
This schema contains configuration tables (often called crosswalks / "xwalks") that map source values to standardized reporting values. Most analysts won't query prod_seed directly, but seeds often explain why a value appears the way it does in the final models.

prod_stage#
Tables in prod_stage typically include light changes such as cleaning data types and making small naming adjustments for readability, while still preserving Ed‑Fi terminology and overall structure. This is a common place to look when you're trying to understand where a value came from or when you're diagnosing upstream data issues.
See an example: stg_ef3_assessments
| K_ASSESSMENT | ACADEMIC_SUBJECT | TENANT_CODE | API_YEAR | PULL_TIMESTAMP | LAST_MODIFIED_TIMESTAMP | FILENAME | IS_DELETED | RECORD_GUID | ASSESSMENT_IDENTIFIER | NAMESPACE | ASSESSMENT_TITLE | ASSESSMENT_VERSION | MAX_RAW_SCORE | NOMENCLATURE | ASSESSMENT_CATEGORY | IS_SINGLE_SUBJECT_IDENTIFIER |
|---|---|---|---|---|---|---|---|---|---|---|---|---|---|---|---|---|
| 0f66079a32ea8a1ac1cc4af38338ada3 | Mathematics | tenant_01 | 2024 | 2025-08-15 07:08:17.441 -0700 | 2025-08-15 07:08:17.441 -0700 | tenant_01/2024/Assessments.jsonl | False | c4ca4238a0b923820dcc509a6f75849b | STAAR_Math | uri://ed-fi.org/Assessment | STAAR Math | 2022 | 54 | STAAR_Math | State assessment | True |
| 18d72f685af48389b27a87c4f941c0ba | Mathematics | tenant_01 | 2026 | 2025-08-15 07:08:17.441 -0700 | 2025-08-15 07:08:17.441 -0700 | tenant_01/2026/Assessments.jsonl | False | c4ca4238a0b923820dcc509a6f75849b | STAAR_Math | uri://ed-fi.org/Assessment | STAAR Math | 2022 | 54 | STAAR_Math | State assessment | True |
| 4a6fe25c7440b456f10df1e851cbc5e8 | English Language Arts | tenant_01 | 2025 | 2025-08-15 07:08:17.441 -0700 | 2025-08-15 07:08:17.441 -0700 | tenant_01/2025/Assessments.jsonl | False | e4da3b7fbbce2345d7772b0674a318d5 | STAAR_Read | uri://ed-fi.org/Assessment | STAAR Read | 2022 | 45 | STAAR_Read | State assessment | True |
prod_wh#
This is where you'll do most of your analysis. Tables here are cleaned and standardized for reporting, follow consistent naming conventions, and are designed to join together predictably. These tables form a dimensional model, which is designed to support efficient querying and clear analytical reasoning.
The next section will dive deeper into the tables found in prod_wh, showing examples of the two main types of tables (dimensions and facts) and how they work together.
Tables#
Now that you understand how data is organized into databases and schemas, let's look at the tables themselves. In ANALYTICS.PROD_WH, EDU organizes tables into two main categories that work together: dimensions and facts.
Dimensions#
Dimensions (tables prefixed with dim_*) describe entities like students, staff, schools, and courses. Think of dimensions as the nouns of the warehouse—they tell you who or what something is. These tables are primarily used for providing context and answering descriptive questions like:
- "Who is this student?"
- "What is this staff member's race or ethnicity?"
- "What is the description of this particular course?"
Dimensions contain attributes and characteristics that help you understand and categorize the entities in your data.
See an example: dim_assessment
| K_ASSESSMENT | TENANT_CODE | SCHOOL_YEAR | ASSESSMENT_IDENTIFIER | NAMESPACE | ASSESSMENT_TITLE | ACADEMIC_SUBJECT | ASSESSMENT_VERSION | MAX_RAW_SCORE | NOMENCLATURE | ASSESSMENT_CATEGORY | GRADES_ARRAY |
|---|---|---|---|---|---|---|---|---|---|---|---|
| 0f66079a32ea8a1ac1cc4af38338ada3 | tenant_01 | 2024 | STAAR_Math | uri://ed-fi.org/Assessment | STAAR Math | Mathematics | 2022 | 54 | STAAR_Math | State assessment | [{"gradeLevelDescriptor": "uri://ed-fi.org/GradeLevelDescriptor#Third grade"}, {"gradeLevelDescriptor": "uri://ed-fi.org/GradeLevelDescriptor#Fourth grade"}, ..., {"gradeLevelDescriptor": "uri://ed-fi.org/GradeLevelDescriptor#Twelfth grade"}] |
| 4a6fe25c7440b456f10df1e851cbc5e8 | tenant_01 | 2025 | STAAR_Read | uri://ed-fi.org/Assessment | STAAR Read | English Language Arts | 2022 | 45 | STAAR_Read | State assessment | [{"gradeLevelDescriptor": "uri://ed-fi.org/GradeLevelDescriptor#Third grade"}, {"gradeLevelDescriptor": "uri://ed-fi.org/GradeLevelDescriptor#Fourth grade"}, ..., {"gradeLevelDescriptor": "uri://ed-fi.org/GradeLevelDescriptor#Twelfth grade"}] |
| 18d72f685af48389b27a87c4f941c0ba | tenant_01 | 2026 | STAAR_Math | uri://ed-fi.org/Assessment | STAAR Math | Mathematics | 2022 | 54 | STAAR_Math | State assessment | [{"gradeLevelDescriptor": "uri://ed-fi.org/GradeLevelDescriptor#Third grade"}, {"gradeLevelDescriptor": "uri://ed-fi.org/GradeLevelDescriptor#Fourth grade"}, ..., {"gradeLevelDescriptor": "uri://ed-fi.org/GradeLevelDescriptor#Twelfth grade"}] |
Facts#
Facts (tables prefixed with fct_*) represent events tied to those entities, such as enrollment records, attendance days, grades, or assessment results. Facts tell you what happened and when it happened. These tables provide event information like:
- "A staff member is teaching a particular course this year"
- "A student was absent on this particular school day"
- "A student received a grade in a specific course"
Fact tables often contain complex business rules that shape how events should be interpreted for reporting, making them ready-to-use for analysis.
See an example: fct_student_daily_attendance
| K_STUDENT | K_STUDENT_XYEAR | K_SCHOOL | K_CALENDAR_DATE | CALENDAR_DATE | K_SESSION | TENANT_CODE | ATTENDANCE_EVENT_CATEGORY | ATTENDANCE_EVENT_REASON | IS_ABSENT | IS_PRESENT | IS_ENROLLED | TOTAL_DAYS_ENROLLED | CUMULATIVE_DAYS_ABSENT | CUMULATIVE_DAYS_ATTENDED | CUMULATIVE_DAYS_ENROLLED | CUMULATIVE_ATTENDANCE_RATE | MEETS_ENROLLMENT_THRESHOLD | IS_CHRONIC_ABSENTEE | EVENT_DURATION | SCHOOL_ATTENDANCE_DURATION | ABSENTEE_CATEGORY_RANK | ABSENTEE_CATEGORY_LABEL |
|---|---|---|---|---|---|---|---|---|---|---|---|---|---|---|---|---|---|---|---|---|---|---|
| 0075f55bc3c4d2f5247763f1f8a81ca6 | 757d4ad7c97d511210559685a3fafcba | 4e9a120e6a61add76faf63ecf1505de4 | b27c4062b62daa2bd65546a0bb1612c3 | 2024-10-17 | a72a70007f0ccf21048f62deca055145 | SYNTHETIC | In Attendance | nan | 0 | 1 | 1 | 145 | 0 | 1 | 1 | 100 | False | False | nan | nan | nan | nan |
| 0075f55bc3c4d2f5247763f1f8a81ca6 | 757d4ad7c97d511210559685a3fafcba | 4e9a120e6a61add76faf63ecf1505de4 | f8a88e5540d70113d6060a4ee3539003 | 2024-10-18 | a72a70007f0ccf21048f62deca055145 | SYNTHETIC | In Attendance | nan | 0 | 1 | 1 | 145 | 0 | 2 | 2 | 100 | False | False | nan | nan | nan | nan |
| 0075f55bc3c4d2f5247763f1f8a81ca6 | 757d4ad7c97d511210559685a3fafcba | 4e9a120e6a61add76faf63ecf1505de4 | e9652b11648ed816d10f7540bd4fa5ed | 2024-10-21 | a72a70007f0ccf21048f62deca055145 | SYNTHETIC | In Attendance | nan | 0 | 1 | 1 | 145 | 0 | 3 | 3 | 100 | False | False | nan | nan | nan | nan |
How dimensions and facts work together#
Together, dimensions and facts create a warehouse where business logic is centralized and tables are predictable. By joining them, you can answer richer analytical questions, such as:
- "How did 5th-grade students at School A perform on the state assessment this year, and how does that compare across demographic groups?"
- "Which teachers are associated with the highest attendance rates in their classrooms, and do those patterns change across grade levels?"
- "How many students enrolled mid-year at each school, and what were their prior-year attendance levels?"
This dimensional model is designed to support efficient querying and clear analytical reasoning. If you are interested in a deeper explanation of dimensional modeling and why EDU uses this structure, you can refer to the EDU documentation on dimensional models.
What to use (most of the time)#
Most of the time you'll work in ANALYTICS.PROD_WH, where the dimension and fact tables live. When you need to investigate how a value originated, ANALYTICS.PROD_STAGE is often the right place to look. And when you want to understand how codes or categories are being mapped/standardized, ANALYTICS.PROD_SEED is usually where that configuration lives.
Wrapping up#
At this point, you understand the hierarchical structure of the EDU warehouse: databases contain schemas, which contain tables. You know that most of your work will happen in ANALYTICS.PROD_WH, and you understand the two main types of tables—dimensions and facts—and how they work together.
Next, we'll zoom in further and explain the specific conventions EDU uses within tables—things like surrogate keys, naming patterns, and how to identify the "grain" of a table—that make joining data predictable and reliable.
« Getting Started