4. Navigating Snowflake
Module 4: Navigating the Snowflake UI#
Now that you’re logged in, welcome to Snowsight, the Snowflake web interface. While Snowflake includes many features to support administration, governance, and advanced workflows, only a small subset is required for day-to-day analytics work. This section focuses on the parts you are most likely to use:
- Search: Your shortcut for finding tables and columns instantly.
- Projects: Where you write SQL, run queries, and save your work.
- Catalog: A map for browsing the warehouse and seeing table details.
- Inside a Workspace: A closer look at the workspace layout you'll use every day.
Always refer to Snowflake's documentation for the latest changes and updates to the Snowsight UI.
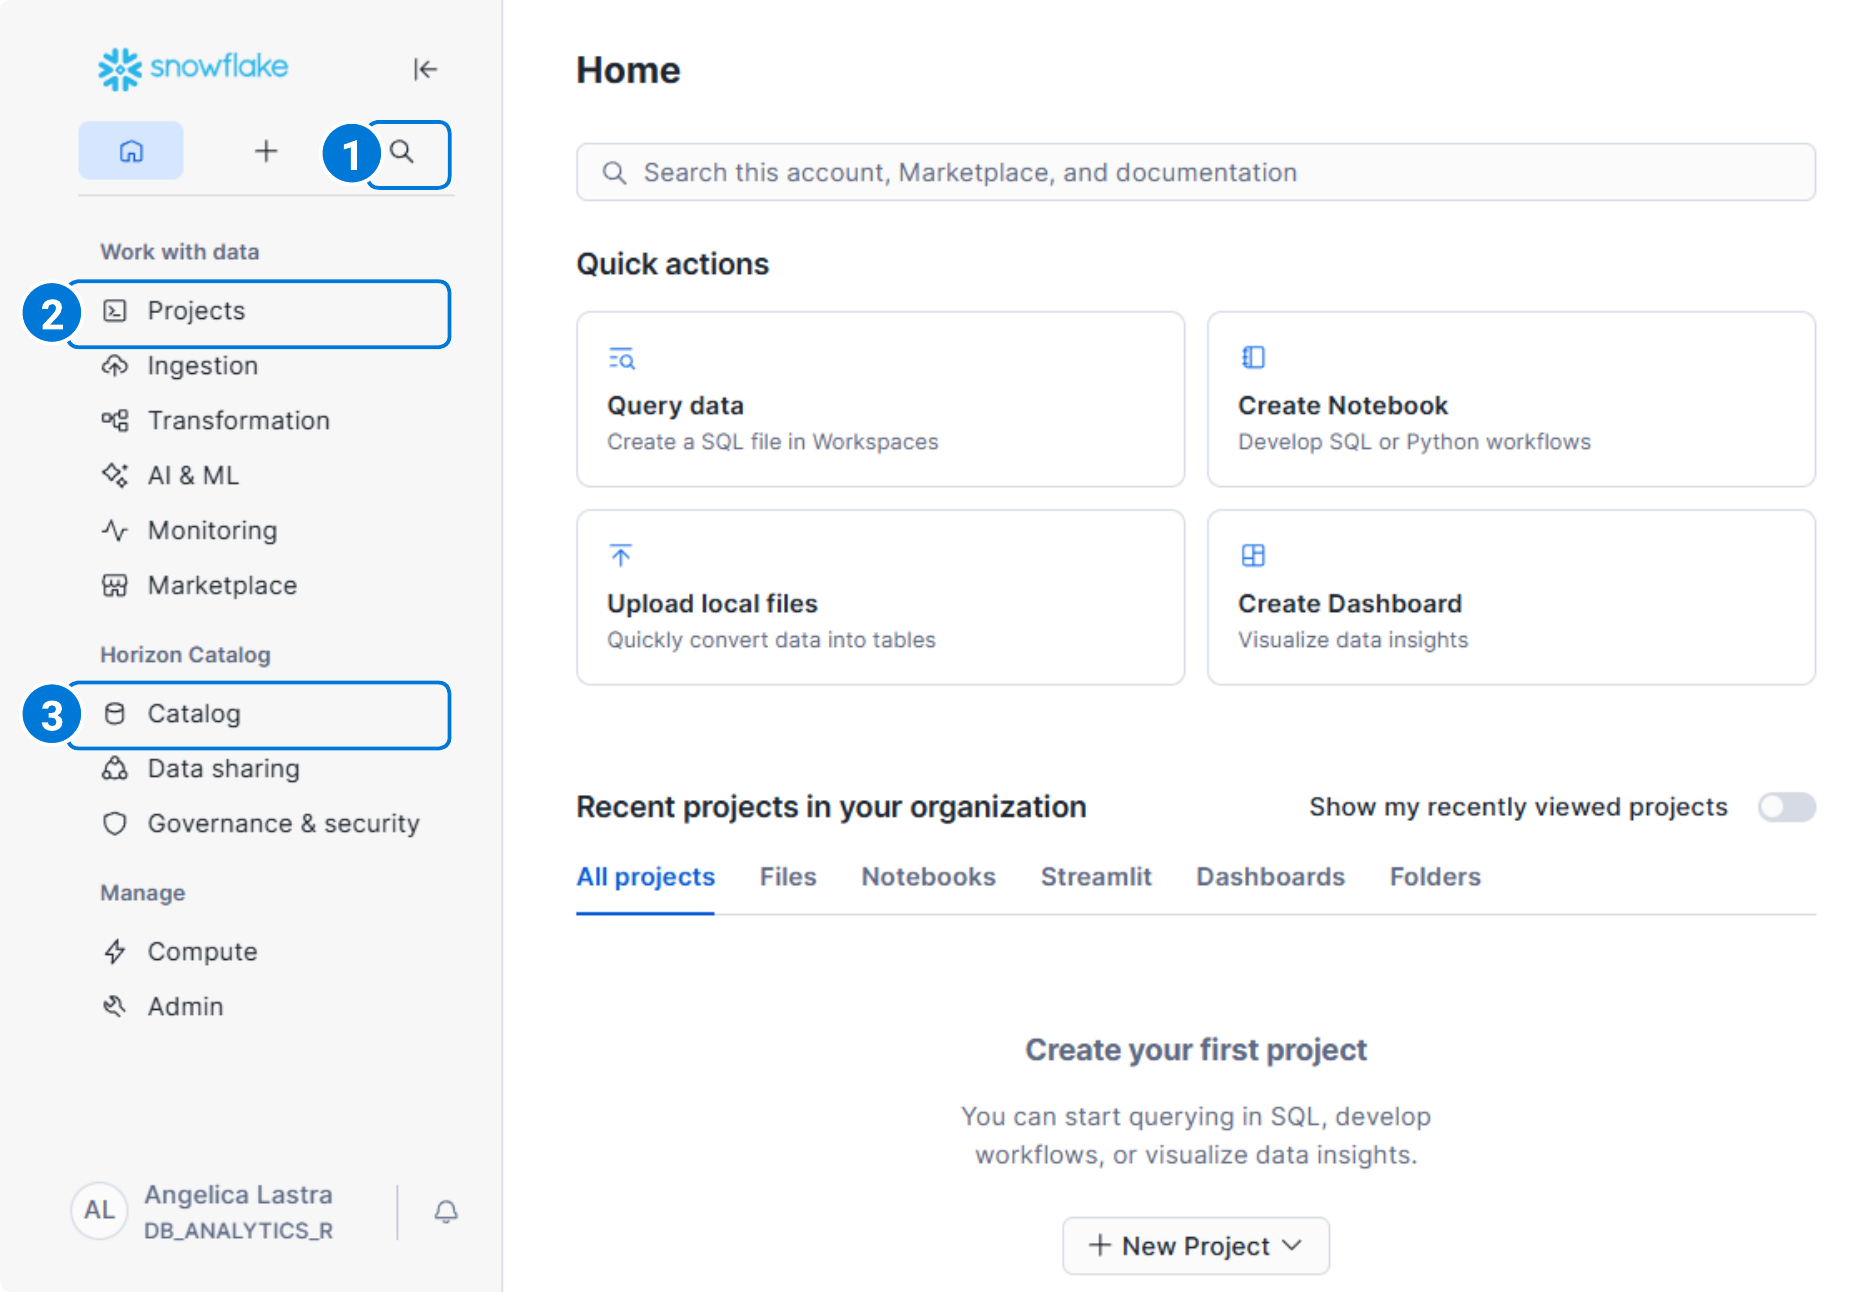
1. Search#
Search is the fastest way to orient yourself in a Snowflake account. This feature allows you to look up databases, schemas, tables, views, columns, and functions across the entire warehouse without needing to manually click through each layer.
If you already know the name of a table or column, Search is usually the quickest way to confirm where it lives and how it is structured. Analysts and BI developers often use Search as a discovery tool when exploring unfamiliar datasets or validating that a table exists before querying it.
Your Turn
Give it a try! Try searching for the dim_assessment table in your Snowflake warehouse.
2. Projects#
Projects is where most hands-on work happens in the Snowflake UI. It acts as a container for tools that let you query data, explore results, and collaborate with others. Within Projects, the most relevant components are: Workspaces, Notebooks, and Dashboards.

Workspaces#
This is where you write and run SQL. If you want to check a student's enrollment or count rows in a table, you'll open a Workspaces to do it. Workspaces allow you to save your queries, organize them into folders, and share them with teammates. In future modules, we’ll be doing almost all our hands-on work inside a Workspaces.
Notebooks#
If you’ve ever used Jupyter or Hex, this will feel familiar. Notebooks let you mix SQL, Python, and Markdown (text) together. Notebooks are often used for more exploratory or iterative work, such as testing transformations, performing deeper analysis, or sharing logic with other users.
Notebooks are optional for most workflows and are not required to understand or use the EDU warehouse, but they can be helpful if you prefer a more narrative or experiment-driven approach to analysis.
Dashboards#
Dashboards allow you to save and share visualizations built directly on Snowflake queries. They are useful for lightweight reporting or quick internal views of data without needing an external BI tool. In many EDU deployments, dashboards are created in downstream BI tools rather than directly in Snowflake, so you may not use this feature often. Still, it can be helpful to know that Snowflake supports basic dashboarding when needed.
3. Inside a Workspace#
Once you open a workspace via Projects → Workspaces, you'll land in the view where most day-to-day querying happens. There are four main areas you will interact with:
- My Workspace
- Database Explorer
- Editor
- Output Pane
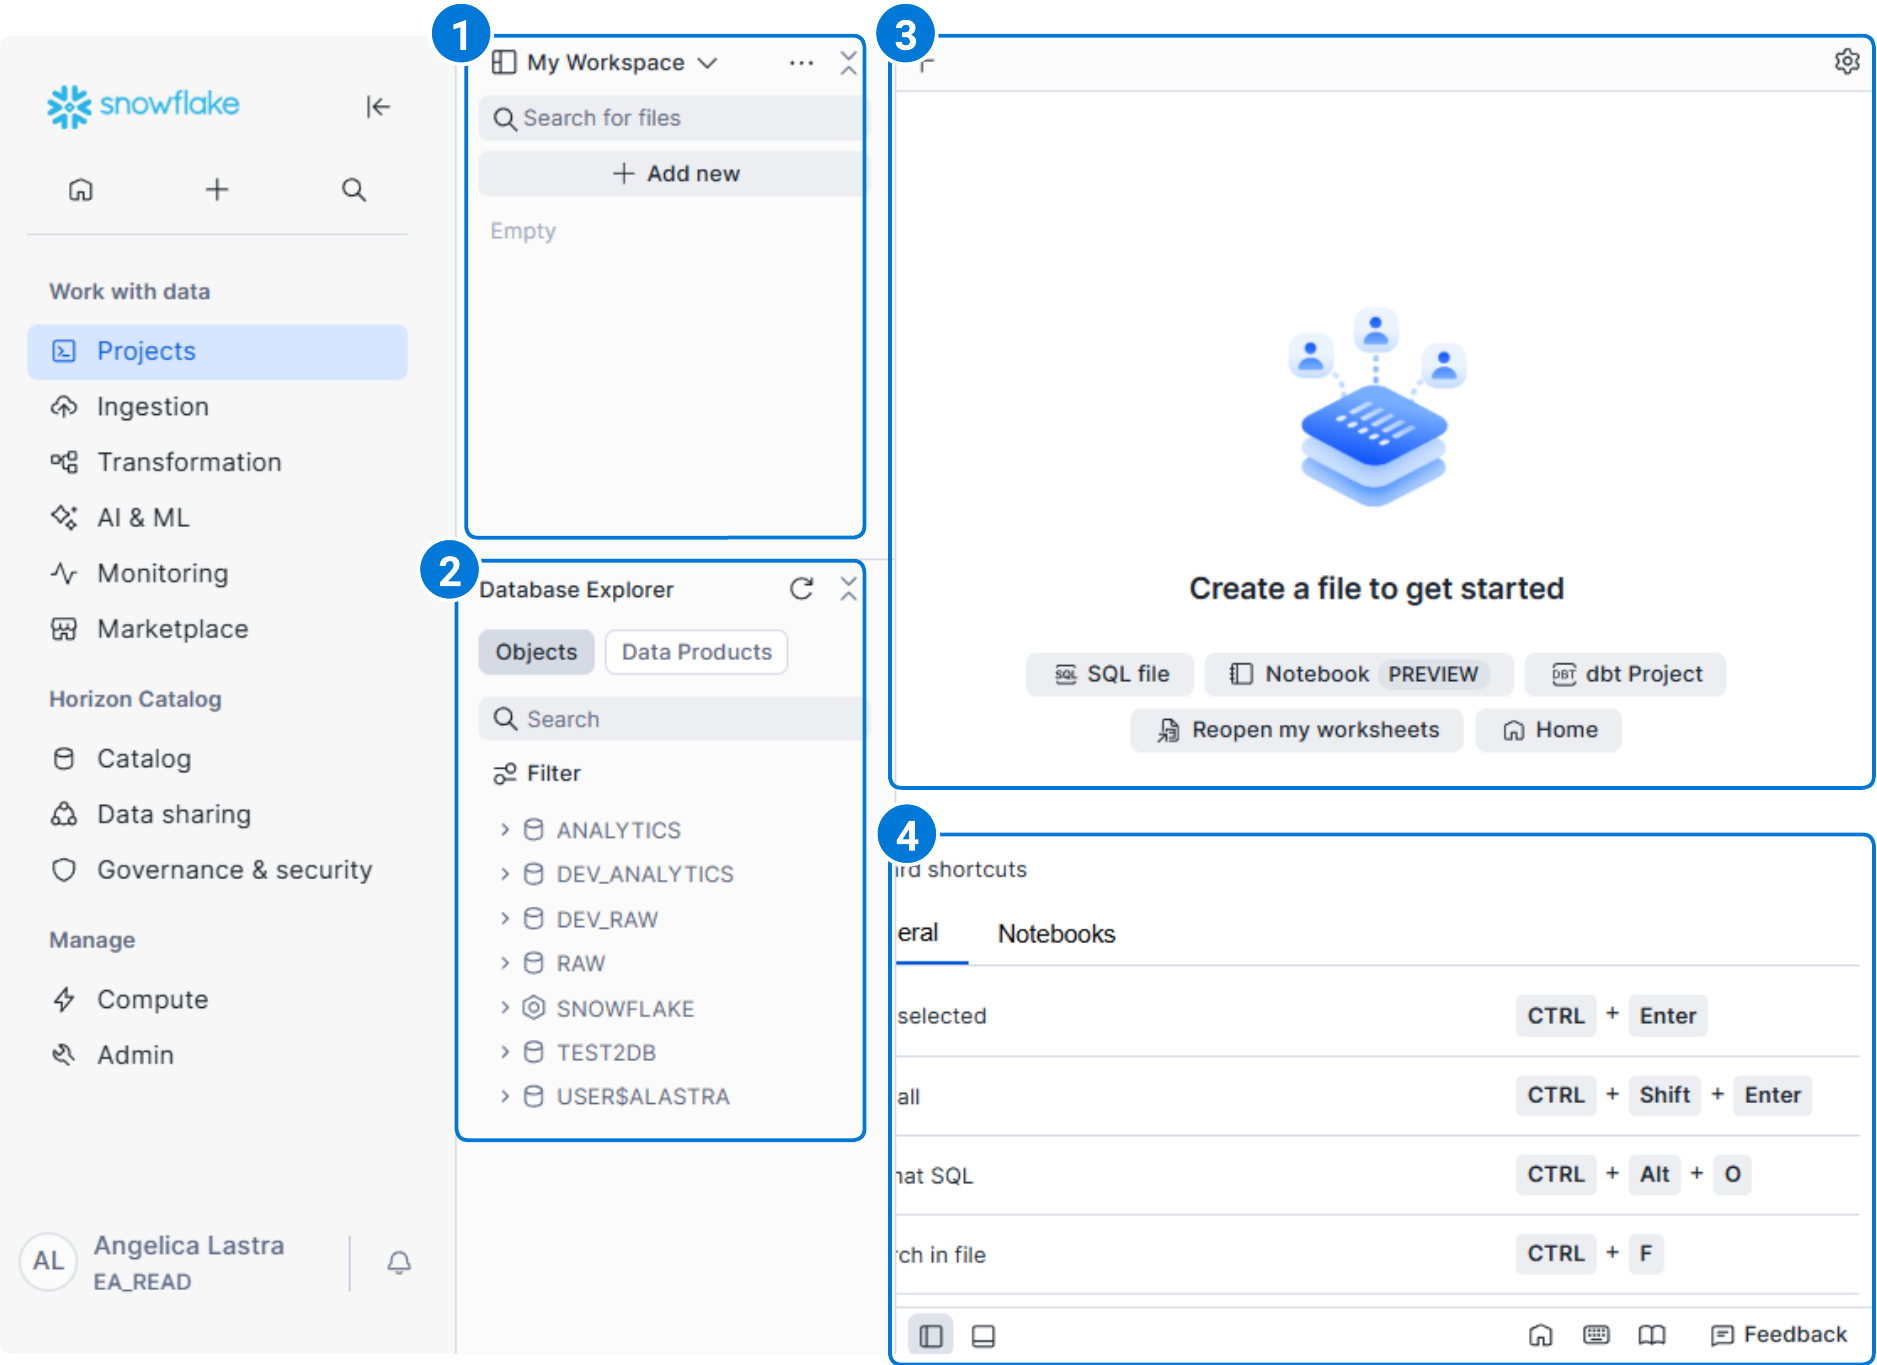
My Workspace#
My Workspace is your personal working area inside Snowflake. This is where your SQL files, worksheets, and notebooks live. It stores saved queries, lets you organize work into files, and helps you return to analysis later.
Anything you create here is private to you unless you explicitly share it. For most users, this is the starting point for querying the warehouse.
Database Explorer#
The Database Explorer is the same structure you can browse in the Catalog, but embedded directly in the workspace view for quick reference. In an EDU environment, you will typically expand the ANALYTICS database and browse schemas like PROD_WH or PROD_STAGE.
This panel is especially useful when you're exploring unfamiliar data, verifying table or column names, or inspecting table definitions before writing SQL.
Editor#
The Editor is the window panel where you write and run SQL. This is the main working area for analysis. From here, you can:
- Write SELECT statements
- Join tables together
- Filter and aggregate data
- Run queries against the warehouse
The querying window supports common SQL editing features such as syntax highlighting and keyboard shortcuts. When you execute a query, Snowflake sends it to the warehouse and returns the results below.
Output Pane#
The Output Pane displays the results of your query after it runs. Depending on the query, this may include:
- A table of results
- Execution status and timing
- Error messages if something goes wrong
This is where you validate whether a query did what you expected. Analysts often move back and forth between the editor and the output pane, refining queries based on what they see in the results.
Previewing Data#
You can preview a table's data by selecting it in the left navigation pane, then clicking the three-dot menu (⋯) and choosing Preview data. This is helpful when you want to understand the structure and values available within a table before adding it to your query.
Quick Navigation Recap#
| If you want to... | Go to... |
|---|---|
| Find a table by name | Search (Top Bar) |
| Write a SQL query | Projects → Workspaces |
| Create exploratory notebooks | Projects → Notebooks |
| Create visualizations | Projects → Dashboards |
| Preview a table's data | Inside a Workspace → Database Explorer |
Wrapping up#
By now, the Snowflake UI should feel a little less like a maze. We've covered how to find data, where to go to query it, how to browse the warehouse structure, and what the workspace layout looks like when you sit down to write SQL.
What's next? In the next module, we'll put that workspace to use and start writing queries against EDU data.
« Authenticating & Connecting
Your First Queries »